Indicated Mineral Resources now contain an estimated 42.0 million ounces
of PGMs plus gold – a gain of 45% – with an additional 52.8 million ounces
in Inferred Resources, at the base case cut-off grade of 2 grams/tonne
At a cut-off grade of 1 gram/tonne, Indicated Mineral Resources now contain
an estimated 58.8 million ounces of PGMs plus gold,
and an additional 94.3 million ounces in Inferred Resources
MIAMI, USA – Ivanhoe Mines (TSX: IVN) Executive Chairman Robert Friedland announced today that Ivanhoe Mines has reported a substantial increase in Indicated and Inferred Mineral Resources at the company’s Platreef Project in the heart of South Africa’s Bushveld Complex, the world’s premier platinum producing region. Details are to be featured in Mr. Friedland’s presentation at the Bank of America Merrill Lynch Global Metals, Mining and Steel Conference in Miami later today.
The updated estimate is for Mineral Resources amenable to underground mining methods within Platreef’s Flatreef Deposit. It is the first update of the overall resource estimate to be issued in more than three years. The new estimate includes the Turfspruit Cyclic Unit (TCU), which hosts the majority of the Flatreef Mineral Resources, and also two additional underground zones of mineralization – the Footwall (FW) and the Bikkuri (BIK) – that occur in close proximity to the TCU.
The Platreef mine development project now underway is based on the Tier One discovery by Ivanhoe Mines’ geologists of platinum-group metals (PGMs), nickel, copper and gold on the Bushveld’s Northern Limb, located near the town of Mokopane in Limpopo Province.
The Platreef Project is owned by Ivanplats (Pty.) Ltd., which is 64%-owned by Ivanhoe Mines. A 26% interest is held by Ivanplats’ broad-based, black economic empowerment partners, which include 20 local host communities that house approximately 150,000 people, historically-disadvantaged project employees and local entrepreneurs. A Japanese consortium of ITOCHU Corporation and its affiliate, ITC Platinum, plus Japan Oil, Gas and Metals National Corporation and JGC Corporation, owns a 10% interest in Ivanplats that was acquired in two tranches for a total investment of US$290 million.
Highlights of the Platreef Project’s updated Mineral Resource estimate include:
- An increase of 58% in the Indicated Mineral Resources tonnage to 346 million tonnes, at a grade of 3.77 grams per tonne (g/t) platinum, palladium, rhodium plus gold (3PE+Au), 0.32% nickel and 0.16% copper, at a cut-off grade of 2.0 g/t 3PE+Au.
- An increase of 21% in the Inferred Mineral Resources tonnage to 506 million tonnes, at a grade of 3.24 g/t 3PE+Au, 0.31% nickel and 0.16% copper, at a cut-off grade of 2.0 g/t 3PE+Au.
- An increase of 45% in the contained metal in Indicated Mineral Resources, at a cut-off grade of 2.0 g/t 3PE+Au, totaling 41.95 million ounces of 3PE+Au, plus a 47% increase in nickel to 2.44 billion pounds and a 50% increase in copper to 1.23 billion pounds.
- Contained metal in Inferred Mineral Resources, at a cut-off grade of 2.0 g/t 3PE+Au, has increased by 11% to total 52.77 million ounces of 3PE+Au, nickel has increased by 13% to total 3.44 billion pounds and copper has increased by 18% to 1.78 billion pounds.
- An average thickness of 19 metres in the area of the TCU-T2 mineralized zone where Indicated Mineral Resources are estimated and an average thickness of 13 metres for the area where Inferred Mineral Resources are estimated, using the 2.0 g/t 3PE+Au cut-off.
Mr. Friedland noted that the Flatreef Deposit is characterized by its very large vertical thicknesses of high-grade mineralization and a platinum-to-palladium ratio of approximately 1:1, which is significantly higher than other recent PGM discoveries on the Bushveld’s Northern Limb.
“The new resource estimate is further confirmation of our belief that the deposit will be a model for safe, mechanized, underground platinum mining in South Africa,” said Mr. Friedland.
“Ivanhoe’s geologists conducted an extensive core relogging program and reinterpreted the structure, stratigraphy and assimilation of host rocks. This re-interpretation, combined with the detailed infill and exploration drilling programs conducted during the past three years, has produced a significant increase in estimated Mineral Resources. There still remains significant exploration upside, as the deposit is open along strike and down dip for several kilometres. We plan to continue advancing this remarkable project at an accelerated pace.”
Dr. Patricia Makhesha, Managing Director of the Platreef Project, also praised the accomplishments of the company’s geological team, several of whom have been with the project for more than a decade.
“We’re confident that the Platreef Project will become a major mining operation and also will contribute significantly to job creation, skills training and economic development opportunities for people and businesses in the Mokopane region and Limpopo Province,” she added.
The updated Mineral Resource estimate was prepared by Ivanhoe Mines under the direction of Dr. Harry Parker, RM SME of Amec Foster Wheeler E&C Services Inc (Amec Foster Wheeler). Dr. Parker and Mr. Timothy Kuhl RM SME, also of Amec Foster Wheeler, have independently confirmed the Mineral Resource estimate and are the Qualified Persons for the estimate, which has an effective date of April 22, 2016. A technical report will be filed on SEDAR at www.sedar.com and on the Ivanhoe Mines website at www.ivanhoemines.com within 45 days of the issuance of this news release.
Substantial increase in Mineral Resources amenable to underground mining methods
The substantial increase in the Platreef Project’s Indicated and Inferred Mineral Resources in the updated 2016 estimate results primarily from the additional 97,737 metres of detailed infill and exploration drilling that was completed between August 2012 and February 2015. A plan view of the additional drilling is shown in Figure 1.
The increase also is driven by a revised and improved geological interpretation by Ivanhoe’s geologists, with additional Mineral Resources now estimated in areas that were drilled before 2013. Since the February 2013 Mineral Resource estimate, Ivanhoe’s geologists have completed relogging of cores and an updated geological interpretation of the entire portion of the Platreef Project amenable to underground mining. The result is estimation of Mineral Resources amenable to selective mining in areas previously categorized as being amenable only to bulk-mining methods.
The consolidated Mineral Resources for the Platreef Project are shown in Table 1 (2.0 g/t 3PE+Au base case highlighted; other cases are included to show the sensitivity of the Mineral Resources to changes in cut-off grades).
Table 1: Platreef Mineral Resource – all mineralized zones (2.0 g/t base case).
| Indicated Mineral Resources – Tonnage and Grades | |||||||||
|---|---|---|---|---|---|---|---|---|---|
| Cut-off Grade (3PE+Au) | Mt | Pt (g/t) |
Pd (g/t) |
Au (g/t) |
Rh (g/t) |
3PE+Au (g/t) |
Cu (%) |
Ni (%) |
|
| 3.0 g/t | 204 | 2.11 | 2.11 | 0.34 | 0.14 | 4.7 | 0.18 | 0.35 | |
| 2.0 g/t | 346 | 1.68 | 1.70 | 0.28 | 0.11 | 3.77 | 0.16 | 0.32 | |
| 1.0 g/t | 716 | 1.11 | 1.16 | 0.19 | 0.08 | 2.55 | 0.13 | 0.26 | |
| Indicated Mineral Resources – Contained Metal | |||||||||
| Cut-off Grade (3PE+Au) | Pt (Moz) |
Pd (Moz) |
Au (Moz) |
Rh (Moz) |
3PE+Au (Moz) |
Cu (Mlbs) |
Ni (Mlbs) |
||
| 3.0 g/t | 13.86 | 13.86 | 2.23 | 0.92 | 30.86 | 800 | 1 597 | ||
| 2.0 g/t | 18.66 | 18.94 | 3.12 | 1.23 | 41.95 | 1 226 | 2 438 | ||
| 1.0 g/t | 25.63 | 26.81 | 4.49 | 1.82 | 58.75 | 2 076 | 4 108 | ||
| Inferred Mineral Resources – Tonnage and Grades | |||||||||
| Cut-off Grade (3PE+Au) | Mt | Pt (g/t) |
Pd (g/t) |
Au (g/t) |
Rh (g/t) |
3PE+Au (g/t) |
Cu (%) |
Ni (%) |
|
| 3.0 g/t | 225 | 1.91 | 1.93 | 0.32 | 0.13 | 4.29 | 0.17 | 0.35 | |
| 2.0 g/t | 506 | 1.42 | 1.46 | 0.26 | 0.10 | 3.24 | 0.16 | 0.31 | |
| 1.0 g/t | 1431 | 0.88 | 0.94 | 0.17 | 0.07 | 2.05 | 0.13 | 0.25 | |
| Inferred Mineral Resources – Contained Metal | |||||||||
| Cut-off Grade (3PE+Au) | Pt (Moz) |
Pd (Moz) |
Au (Moz) |
Rh (Moz) |
3PE+Au (Moz) |
Cu (Mlbs) |
Ni (Mlbs) |
||
| 3.0 g/t | 13.78 | 13.96 | 2.33 | 0.94 | 31.01 | 865 | 1, 736 | ||
| 2.0 g/t | 23.17 | 23.78 | 4.26 | 1.56 | 52.77 | 1,775 | 3, 440 | ||
| 1.0 g/t | 40.38 | 43.01 | 7.81 | 3.06 | 94.27 | 4,129 | 7,759 | ||
- Mineral Resources have an effective date of April 22, 2016. The Qualified Persons for the estimate are Dr. Harry Parker, RM SME, and Timothy Kuhl, RM SME, who are employees of Amec Foster Wheeler E&C Services Inc. and independent of Ivanhoe. Mineral Resources that are not Mineral Reserves do not have demonstrated economic viability.
- The 2 g/t 3PE+Au cut-off is considered the base case estimate and is highlighted. The rows are not additive.
- Mineral Resources are reported on a 100% basis. Mineral Resources are stated from approximately -200 m to 650 m elevation (from 500 m to 1,350 m depth). Indicated Mineral Resources are drilled on approximately 100 x 100 m spacing (locally 150 m spacing); Inferred Mineral Resources are drilled on 400 x 400 m (locally to 400 x 200 m and 200 x 200 m) spacing.
- Mineral Resources have been estimated on an externally undiluted basis and without consideration for mining recovery. Dilution and mining recoveries will vary with the geometry (dip, thickness, faulting and or irregularities in contacts) of the mineralization and the eventual mining method used.
- Reasonable prospects for eventual economic extraction were determined using the following assumptions. Assumed commodity prices are Pt: $1,600/oz, Pd: $815/oz, Au: $1,300/oz, Rh: $1,500/oz, Cu: $3.00/lb and Ni: $8.90/lb. It has been assumed that payable metals would be 82% from a smelter/refinery and that mining costs (average $34.27/t) and process, G&A, and concentrate transport costs (average $15.83/t of mill feed for a 4 Mtpa operation) would be covered. The processing recoveries vary with block grade but typically would be 80%-90% for Pt, Pd and Rh; 70-90% for Au, 60-90% for Cu, and 65-75% for Ni.
- 3PE+Au = Pt + Pd + Rh + Au.
- Totals may not sum due to rounding.
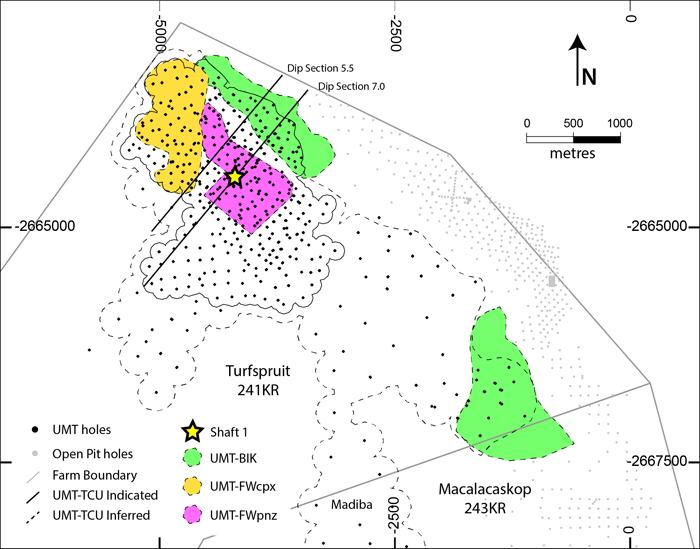
The consolidated Mineral Resources for the Platreef Project now include Mineral Resources in the Bikkuri area (UMT-BIK) and additional Mineral Resources in the footwall of the key mineralized zone, the TCU, referred to collectively as the UMT-FW. The UMT-FW consists of two zones, the FWcpx and FWpnz. The location of the various mineralized zones (Resource Areas) in a plan view is shown in Figure 2.
Dr. Harry Parker, Consulting Mining Geologist and Geostatistician, and Timothy Kuhl, Principal Geologist, both of Amec Foster Wheeler, worked in collaboration with George Gilchrist, of Ivanhoe, on the Mineral Resource model and the Mineral Resource tabulation, and Dr. Parker and Mr. Kuhl are the Qualified Persons for the estimate. Dr. Parker and Mr. Kuhl are of the opinion that the Mineral Resources for the Platreef Project have been estimated using industry-leading practices and conform to the requirements of the 2014 Definition Standards for Mineral Resources and Mineral Reserves as set forth by the Canadian Institute of Mining and Metallurgy, incorporated by reference into NI 43-101.
Figure 1: Platreef’s Indicated Resources shown in green; Inferred Resources in blue; areas of resource expansion indicated with diagonal lines; exploration target areas in beige. Additional detail on the exploration target areas is shown in Figure 7.
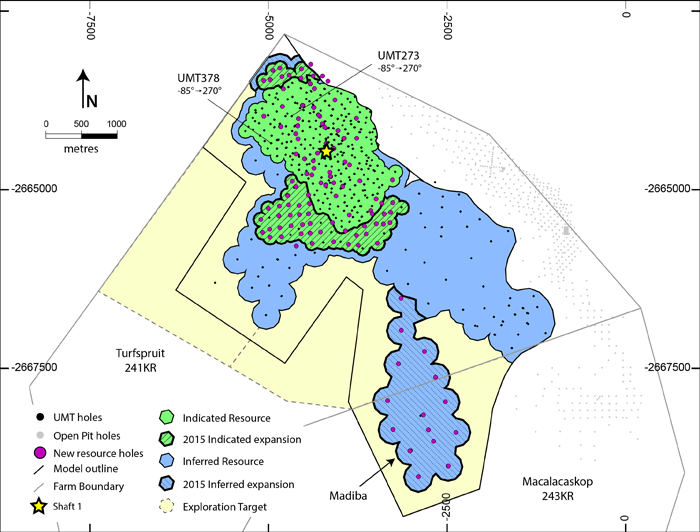
Figure 2: Plan view showing location of the new resource areas relative to Shaft 1. Bikkuri Mineral Resources (UMT-BIK) is shown in green; the two separate domains of Footwall Mineral Resources (UMT-FW) are shown in orange (UMT-FWcpx) and purple (UMT-FWpnz).
Mineral Resources in the UMT-TCU
The Mineral Resources in the UMT-TCU, which make up the majority of the Mineral Resources amenable to selective mining for the Platreef Project, are those contained within, or immediately adjacent to, the TCU. The TCU is interpreted by Ivanplats’ geologists to be analogous to the Merensky Cyclic Unit of the Bushveld’s Western and Eastern limbs.
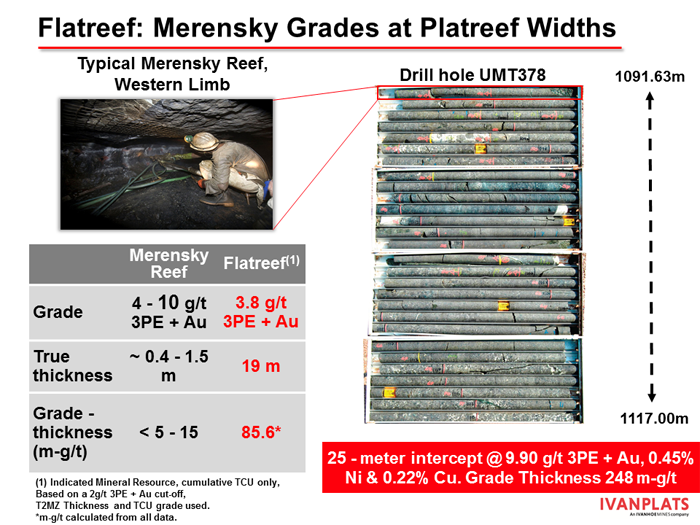
The mineralization is characterized by its very large vertical thicknesses of high-grade mineralization and a platinum-to-palladium ratio of approximately 1:1, which is significantly higher than average for the Bushveld’s Northern Limb. The 2.0 g/t 3PE+Au grade shell used to constrain UMT-TCU mineralization in the area where Indicated Mineral Resources are declared has an average true thickness of approximately 19 metres, compared with approximately 0.4 to 1.5 metres for a typical Merensky Reef intersection of the Bushveld’s Western and Eastern limbs, as illustrated in Figure 3.
Figure 3: Comparison of the relative widths of a typical Merensky and Platreef reefs.
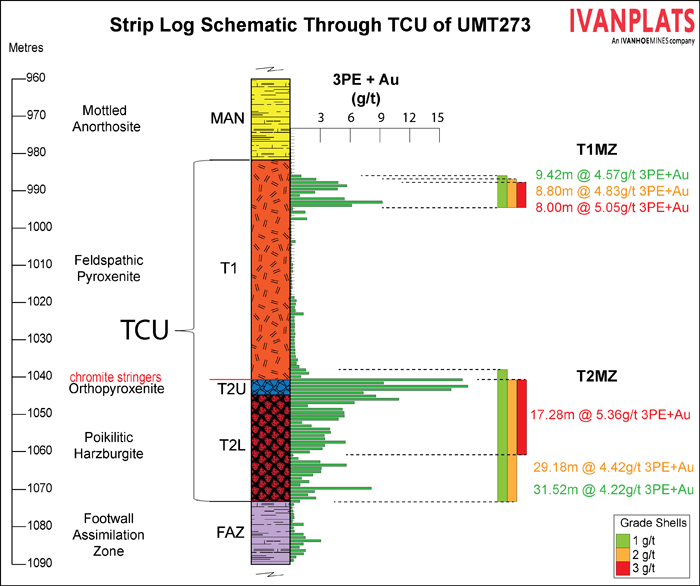
The TCU hosts two mineralized zones that are laterally continuous across the Platreef Project (figures 4 and 5). The T1 mineralized zone (T1MZ) occurs within cyclical magmatic units and feldspathic pyroxenite immediately below the Main Zone, and the T2 mineralized zone (T2MZ) is hosted within a mineralized, PGM-enriched pegmatoid distinct from the feldspathic pyroxenite above it and bound by a top chromite stringer. The T2MZ occurs at a stratigraphic position similar to the world-renowned Merensky Reef. The T2MZ can be subdivided into an upper pegmatoidal orthopyroxenite, referred to as the T2 Upper, and a lower, less continuous pegmatoidal harzburgite, referred to as the T2 Lower. Recognition of the TCU and the pegmatoidal pyroxenite in 2012 was a key interpretive breakthrough for the Platreef Project.
The T1MZ 2.0 g/t 3PE+Au grade shell has an average true thickness of 3.9 metres for the Indicated Mineral Resource area and 3.8 metres for the Inferred Mineral Resource area. The T2MZ 2.0 g/t 3PE+Au grade shell has an average true thickness of 19 metres for the Indicated Mineral Resource area and 15 metres for the Inferred Mineral Resource area. The TCU T2MZ also demonstrates significant concentration of the highest grade near the top of the mineralized zone (“top loading”) and continuity of grade at elevated cut-offs that could allow for more selective mining scenarios. This is illustrated in figures 4 and 5.
Figure 4: Flatreef cross section showing T1 and T2 mineralized zones (T1MZ and T2MZ), and the significant top loading of the T2 mineralized zone.
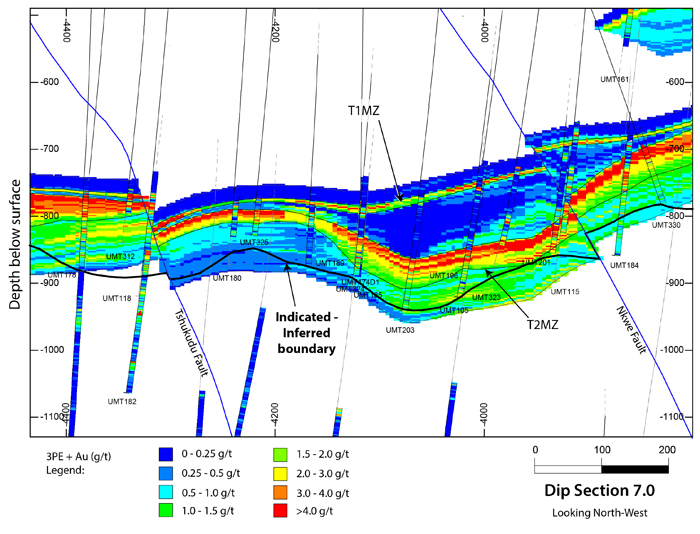
Figure 5: Strip log schematic of drill hole UMT273 showing top-loaded nature of T2MZ.
The 2013 Mineral Resource statement for mineralization considered amenable to selective mining methods was based solely on the Mineral Resource estimated for the TCU, and the 2014 pre-feasibility study only considered Indicated Mineral Resources within the TCU. Both Indicated and Inferred Mineral Resources for the TCU have been expanded as a result of exploration drilling, within the expansion areas shown in Figure 1.
The 58% increase in the tonnage of the Platreef Project’s Indicated Mineral Resources is driven primarily by the successful infill drilling program that was completed in February 2015. UMT-TCU Indicated Mineral Resource now totals 339 million tonnes at 3.79 g/t 3PE+Au, 0.32% nickel and 0.16% copper (see Table 2).
The Inferred Mineral Resources within the UMT-TCU increased by 10%, to now total 459 million tonnes at a grade of 3.29 g/t 3PE+Au, 0.31% nickel and 0.16% copper (see Table 2). The increase in Mineral Resources is supported by additional drilling in the Platreef Project’s Madiba Zone.
Mineral Resources in the UMT-BIK
Mineral Resources within the Bikkuri Reef are located in a separate reef above the TCU mineralization, but show similar geological characteristics to the TCU. The Bikkuri zones are thought to represent structurally-emplaced blocks of TCU stratigraphy, for which Mineral Resources have been estimated using the same approach as for the UMT-TCU. The mineralization occurs in two distinct locations within the Platreef Project, with one zone located to the north of Shaft 1 and the second located southeast of Shaft 1, as illustrated in Figure 2. The relative vertical position of the Bikkuri zone with respect to the TCU in the north area is shown in section view in Figure 6.
The Bikkuri reef area that is located to the north of Shaft 1, contains Mineral Resources that were previously reported in the 2013 Mineral Resource update, while the Bikkuri reef area that is located southeast of Shaft 1, was identified during the revised geological interpretation. Indicated Mineral Resources for the Bikkuri reef total seven million tonnes at a grade of 2.81 g/t 3PE+Au, 0.35% nickel and 0.19% copper and occur solely in the north area. Inferred Mineral Resources for the Bikkuri reef total 27 million tonnes at a grade of 2.72 g/t 3PE+Au, 0.30% nickel and 0.16% copper (see Table 3). The 2.0 g/t 3PE + Au grade shell used in the estimation of the Mineral Resource averages 5.7 metres in thickness in the Indicated Mineral Resources area.
Mineral Resources in the UMT-FW
The Mineral Resources in the UMT-FW are considered to be amenable to selective mining methods, and are supported by an enhanced level of geological understanding gained from detailed review and re-interpretation of the geology and structure of the footwall to the TCU. Two separate domains have been identified in the FW: the FWcpx domain and the FWpnz domain, as shown in Figure 2.
Mineralization in the FWcpx domain is hosted in a massive, essentially homogeneous, unit of clinopyroxene-dominated pyroxenite that averages 84 metres in true thickness and sits below the UMT-TCU mineralized zone in the northwest of the project. Figure 6 shows the location of the UMT-FWcpx zone relative to the UMT-TCU.
Mineralization in the FWpnz domain is hosted in a series of pyroxenite-norite layers that are separated by metasedimentary rocks. Six stacked grade shells, or mineralized zones, coded AMZ to FMZ, were modelled using a 1.0 g/t 3PE+Au cutoff. The zones range in average thickness from approximately 12 to 34 metres.
The continuity of FW mineralization has been modelled based on limited drill data, as not all of the UMT drill holes extended into the FW. For this reason, estimation of Mineral Resources has been restricted to the northwestern area of the Platreef Project where drill spacing is in the order of 100 metres to 200 metres. Similar mineralization has been seen in drill holes across the entire Platreef Project, but the current drill spacing is insufficient to define Mineral Resources amenable to selective mining methods in these areas. This represents exploration upside for the Platreef Project.
Drill intercepts ≥ 2.0 g/t 3PE+Au in the FW domains are narrow, and suggest selective mining would be required. Grade continuity is best observed at a 1.0 to 1.5 g/t 3PE+Au cutoff. Discontinuous pods of mineralization at a 2.0 g/t 3PE+Au cutoff are present, but are not well defined at the current drill spacing, and additional drilling is required. The FWcpx domain includes thicker zones of low-grade mineralization that may permit mass mining methods at a lower cutoff (1 g/t 3PE+Au).
Inferred Mineral Resources in the UMT-FW, at a 2.0 g/t 3PE+Au cut-off grade, total 20 million tonnes at 2.76 3PE+Au, 0.34% nickel and 0.19% copper, and are shown in Table 4.
Figure 6: Section Line 5.5 showing the Turfspruit Cyclic Unit (TCU), shown in red, which hosts the majority of the Flatreef Mineral Resources, and also the additional underground zones of mineralization – the Footwall FWcpx shown in purple with cross hatches, the FWpnz, shown in green with diagonal lines and the Bikkuri (BIK), shown in gray – that occur in close proximity to the TCU.
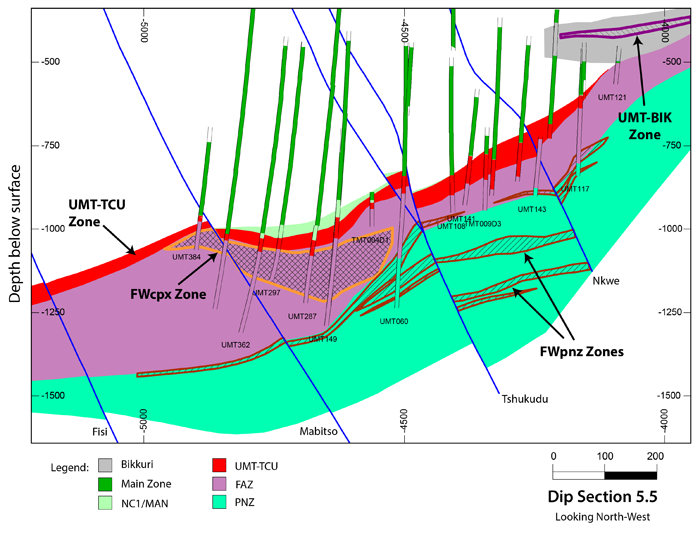
Table 2: Mineral Resource for the TCU only (base case is highlighted),assuming selective underground mining methods.
| Indicated Mineral Resources – Tonnage and Grades | ||||||||
|---|---|---|---|---|---|---|---|---|
| Cut-off Grade (3PE+Au) | Mt | Pt (g/t) |
Pd (g/t) |
Au (g/t) |
Rh (g/t) |
3PE+Au (g/t) |
Cu (%) |
Ni (%) |
| 3.0 g/t | 202 | 2.11 | 2.12 | 0.34 | 0.14 | 4.71 | 0.18 | 0.35 |
| 2.0 g/t | 339 | 1.68 | 1.71 | 0.28 | 0.11 | 3.79 | 0.16 | 0.32 |
| 1.0 g/t | 685 | 1.13 | 1.18 | 0.20 | 0.08 | 2.59 | 0.13 | 0.26 |
| Indicated Mineral Resources – Contained Metal | ||||||||
| Cut-off Grade (3PE+Au) | Pt (Moz) |
Pd (Moz) |
Au (Moz) |
Rh (Moz) |
3PE+Au (Moz) |
Cu (Mlbs) |
Ni (Mlbs) |
|
| 3.0 g/t | 13.73 | 13.74 | 2.20 | 0.91 | 30.58 | 788 | 1 576 | |
| 2.0 g/t | 18.38 | 18.69 | 3.06 | 1.22 | 41.34 | 1, 197 | 2, 386 | |
| 1.0 g/t | 24.9 | 26.09 | 4.32 | 1.77 | 57.09 | 1, 977 | 3, 938 | |
| Inferred Mineral Resources – Tonnage and Grades | ||||||||
| Cut-off Grade (3PE+Au) | Mt | Pt (g/t) |
Pd (g/t) |
Au (g/t) |
Rh (g/t) |
3PE+Au (g/t) |
Cu (%) |
Ni (%) |
| 3.0 g/t | 212 | 1.93 | 1.95 | 0.32 | 0.13 | 4.33 | 0.17 | 0.35 |
| 2.0 g/t | 459 | 1.45 | 1.48 | 0.27 | 0.10 | 3.29 | 0.16 | 0.31 |
| 1.0 g/t | 1213 | 0.91 | 0.96 | 0.18 | 0.07 | 2.12 | 0.13 | 0.25 |
| Inferred Mineral Resources – Contained Metal | ||||||||
| Cut-off Grade (3PE+Au) | Pt (Moz) |
Pd (Moz) |
Au (Moz) |
Rh (Moz) |
3PE+Au (Moz) |
Cu (Mlbs) |
Ni (Mlbs) |
|
| 3.0 g/t | 13.09 | 13.26 | 2.19 | 0.90 | 29.44 | 802 | 1 625 | |
| 2.0 g/t | 21.33 | 21.88 | 3.92 | 1.44 | 48.58 | 1, 591 | 3, 103 | |
| 1.0 g/t | 35.44 | 37.54 | 6.86 | 2.65 | 82.5 | 3, 472 | 6, 579 | |
See notes under Table 1. Mineral Resources in this table are not additive to the Mineral Resources in Table 1.
Table 3: Mineral Resources for the Bikkuri zone only (base case is highlighted),assuming selective underground mining methods. Indicated Mineral Resources – Tonnage
| Indicated Mineral Resources – Tonnage and Grades | ||||||||
|---|---|---|---|---|---|---|---|---|
| Cut-off Grade (3PE+Au) | Mt | Pt (g/t) |
Pd (g/t) |
Au (g/t) |
Rh (g/t) |
3PE+Au (g/t) |
Cu (%) |
Ni (%) |
| 3.0 g/t | 2 | 1.67 | 1.45 | 0.34 | 0.09 | 3.55 | 0.22 | 0.40 |
| 2.0 g/t | 7 | 1.30 | 1.16 | 0.28 | 0.07 | 2.81 | 0.19 | 0.35 |
| 1.0 g/t | 31 | 0.73 | 0.71 | 0.16 | 0.05 | 1.65 | 0.14 | 0.24 |
| Indicated Mineral Resources – Contained Metal | ||||||||
| Cut-off Grade (3PE+Au) | Pt (Moz) |
Pd (Moz) |
Au (Moz) |
Rh (Moz) |
3PE+Au (Moz) |
Cu (Mlbs) |
Ni (Mlbs) |
|
| 3.0 g/t | 0.13 | 0.12 | 0.03 | 0.01 | 0.28 | 12 | 22 | |
| 2.0 g/t | 0.29 | 0.26 | 0.06 | 0.01 | 0.62 | 29 | 52 | |
| 1.0 g/t | 0.74 | 0.71 | 0.17 | 0.05 | 1.67 | 99 | 170 | |
| Inferred Mineral Resources – Tonnage and Grades | ||||||||
| Cut-off Grade (3PE+Au) | Mt | Pt (g/t) |
Pd (g/t) |
Au (g/t) |
Rh (g/t) |
3PE+Au (g/t) |
Cu (%) |
Ni (%) |
| 3.0 g/t | 8 | 1.59 | 1.52 | 0.36 | 0.09 | 3.55 | 0.20 | 0.37 |
| 2.0 g/t | 27 | 1.23 | 1.17 | 0.25 | 0.07 | 2.72 | 0.16 | 0.30 |
| 1.0 g/t | 112 | 0.75 | 0.76 | 0.15 | 0.05 | 1.72 | 0.14 | 0.24 |
| Inferred Mineral Resources – Contained Metal | ||||||||
| Cut-off Grade (3PE+Au) | Pt (Moz) |
Pd (Moz) |
Au (Moz) |
Rh (Moz) |
3PE+Au (Moz) |
Cu (Mlbs) |
Ni (Mlbs) |
|
| 3.0 g/t | 0.41 | 0.39 | 0.09 | 0.02 | 0.92 | 35 | 65 | |
| 2.0 g/t | 1.09 | 1.03 | 0.22 | 0.06 | 2.40 | 100 | 184 | |
| 1.0 g/t | 2.70 | 2.74 | 0.56 | 0.19 | 6.19 | 353 | 593 | |
See notes under Table 1. Mineral Resources in this table are not additive to the Mineral Resources in Table 1.
Table 4: Mineral Resource for the UMT-FW only (base case is highlighted),assuming selective underground mining methods.
| Inferred Mineral Resources – Tonnage and Grades | ||||||||
|---|---|---|---|---|---|---|---|---|
| Cut-off Grade (3PE+Au) | Mt | Pt (g/t) |
Pd (g/t) |
Au (g/t) |
Rh (g/t) |
3PE+Au (g/t) |
Cu (%) |
Ni (%) |
| 2.5 g/t | 9 | 1.44 | 1.66 | 0.24 | 0.09 | 3.43 | 0.22 | 0.39 |
| 2.0 g/t | 20 | 1.15 | 1.34 | 0.19 | 0.08 | 2.76 | 0.19 | 0.34 |
| 1.5 g/t | 49 | 0.88 | 1.04 | 0.15 | 0.07 | 2.14 | 0.16 | 0.29 |
| 1.0 g/t | 105 | 0.66 | 0.81 | 0.11 | 0.07 | 1.65 | 0.13 | 0.25 |
| Inferred Mineral Resources – Contained Metal | ||||||||
| Cut-off Grade (3PE+Au) | Pt (Moz) |
Pd (Moz) |
Au (Moz) |
Rh (Moz) |
3PE+Au (Moz) |
Cu (Mlbs) |
Ni (Mlbs) |
|
| 2.5 g/t | 0.43 | 0.49 | 0.07 | 0.03 | 1.02 | 45 | 80 | |
| 2.0 g/t | 0.75 | 0.87 | 0.12 | 0.05 | 1.79 | 84 | 153 | |
| 1.5 g/t | 1.39 | 1.65 | 0.23 | 0.11 | 3.38 | 169 | 318 | |
| 1.0 g/t | 2.23 | 2.73 | 0.39 | 0.23 | 5.58 | 304 | 587 | |
See notes under Table 1. Mineral Resources in this table are not additive to the Mineral Resources in Table 1.
Potential for additional UMT-TCU mineralization within targets for further exploration
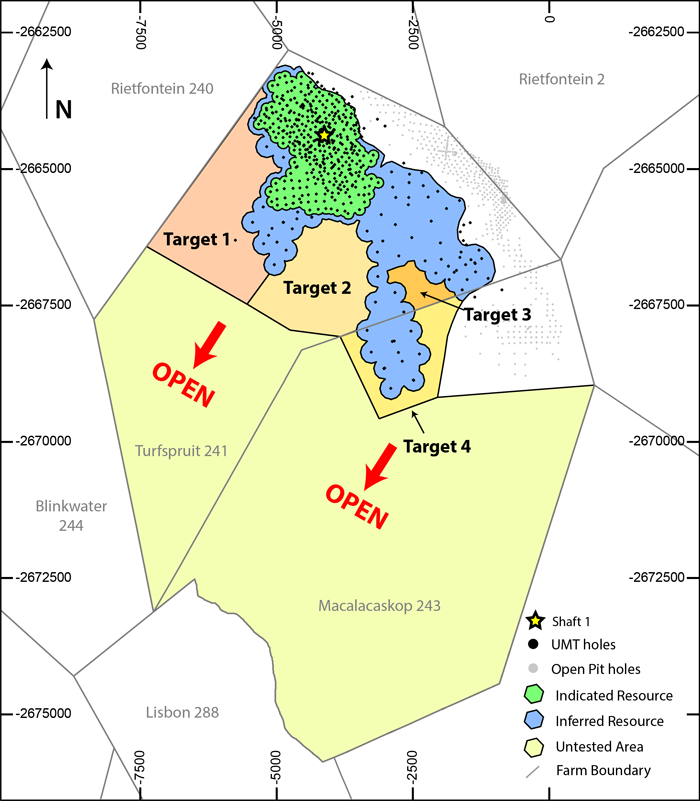
Exploration potential exists immediately outside the area of Inferred Mineral Resources that has not been explored by Ivanhoe. Amec Foster Wheeler has defined four targets for further exploration (exploration targets) in areas that are contiguous with the current Mineral Resource areas that are shown in Figure 7.
Target 1 could contain 150 to 250 million tonnes grading 1.2 to 1.9 g/t Pt, 1.2 to 1.9 g/t Pd, 0.19 to 0.32 g/t Au, 0.08 to 0.14 g/t Rh, (2.6 to 4.3 g/t 3PE+Au), 0.11 to 0.19% Cu and 0.23 to 0.38% Ni over an area of 4.1 km2. The tonnage and grades are based on intersections of 2.0 g/t 3PE+Au mineralization in drill holes located adjacent to the target.
Target2 could contain 50 to 90 million tonnes grading 1.3 to 2.1 g/t Pt, 1.4 to 2.3 g/t Pd, 0.19 to 0.31 g/t Au, 0.11 to 0.18 g/t Rh, (2.9 to 4.9 g/t 3PE+Au), 0.11 to 0.19% Cu and 0.23 to 0.39% Ni over an area of 3.9 km2. The tonnage and grades are based on intersections of 2.0 g/t 3PE+Au mineralization in drill holes located adjacent to the target.
Target 3 could contain 5 to 10 million tonnes grading 1.3 to 2.2 g/t Pt, 1.1 to 1.9 g/t Pd, 0.20 to 0.34 g/t Au, 0.10 to 0.17 g/t Rh, ( 2.7 to 4.6 g/t 3PE+Au), 0.11 to 0.18% Cu and 0.23 to 0.38% Ni over an area of 0.5 km2. The tonnage and grades are based on intersections of 2.0 g/t 3PE+Au mineralization in drill holes located adjacent to the target.
Target 4 could contain 40 to 60 million tonnes grading 1.3 to 2.2 g/t Pt, 1.5 to 2.5 g/t Pd, 0.18 to 0.30 g/t Au, 0.12 to 0.20 g/t Rh, (3.1 to 5.2 g/t 3PE+Au), 0.10 to 0.17% Cu and 0.22 to 0.36% Ni over an area of 1.5 km2. The tonnage and grades are based on intersections of 2.0 g/t 3PE+Au mineralization in drill holes located adjacent to the target.
The potential quantity and grade of these exploration targets is conceptual in nature. There has been insufficient exploration and/or study to define these exploration targets as Mineral Resources. It is uncertain if additional exploration will result in these exploration targets being delineated as a Mineral Resource.
In addition, there are approximately 48 km2 of unexplored ground beyond these exploration target areas on the property under which the prospective stratigraphy is projected to lie. It is not possible to estimate a range of tonnages and grades for this ground with current information. There is excellent potential for mineralization to significantly increase with further step-out drilling to the southwest.
Figure 7: Mineralization at the Platreef Project is open to expansion to the south and west, beyond the area of the current Mineral Resources. Indicated Resources are shown in green and Inferred Resources are shown in blue.
Shaft 1 construction update
Following the changeover of shaft-sinking equipment from the pre-sinking phase, the main sinking work is expected to begin in early June, 2016. Aveng Mining, the shaft-sinking contractor, expects sinking to advance at an average daily rate of approximately 2.5 metres.
Included in the sinking contract is the development of two main stations at depths of 450 metres and 750 metres below surface. Shaft 1 is expected to reach the Flatreef Deposit at a depth of 777 metres below surface during the third quarter of 2017.
Shaft 1 will provide early development access into the deposit and will be utilized to fast track the production during the first phase of the project.
Platreef’s Shaft 1 head gear provides backdrop for a gathering of project team membersand contractors.

Planned mining methods to incorporate highly productive, mechanized methods
The selected mining areas proposed in the current Platreef Project pre-feasibility study mine plan occur at depths ranging from approximately 700 metres to 1,200 metres below the surface. Four vertical shafts are expected to provide the main access to the Flatreef Deposit and ventilation. Shaft 2 will host the main personnel transport cage, material and ore-handling systems, while Shafts 1, 3 and 4 are planned to be utilized for ventilation to the underground workings. Shaft 1, now under development, will be used for initial access to the deposit and early underground development.
The planned mining methods will use highly productive, mechanized methods, including long-hole stoping, drift-and-bench and drift-and-fill mining methods. The mined-out areas within the deposit will be backfilled with a paste mixture that utilizes tailings from the process plant and cement. The ore will be hauled from the stopes to a series of ore passes that will connect to a main haulage level connected to Shaft 2, where it will be hoisted to the surface for processing.
Shaft 2 will have an internal diameter of 10 metres and will have the capacity to hoist six million tonnes per year. The headgear design for the six-million-tonne-per-year permanent hoisting facility has been completed by South Africa-based Murray & Roberts Cementation. Ivanhoe expects to start Shaft 2 early works, including civil work for the box-cut and hitch-foundation, in 2017.
The Mineral Resource update reported in this release was prepared for use in ongoing engineering studies at a feasibility level on the Platreef Project. The updated Mineral Resources include those that were the basis of the Mineral Reserves reported in the Platreef 2014 Pre-Feasibility Study Technical Report dated January 2015. It is the opinion of the QP for the Mineral Reserves, Mr. Mel Lawson, RM, SME that changes to the underlying Mineral Resource do not materially affect the Mineral Reserves and that the Mineral Reserves remain current effective January 8, 2015.
Qualified persons, quality control and assurance
The independent qualified persons for the updated Mineral Resource estimate for the Platreef Project are Dr. Harry Parker and Timothy Kuhl, both of Amec Foster Wheeler.
The scientific and technical information in this news release has been reviewed and approved by Stephen Torr, P.Geo., Ivanhoe Mines’ Vice President, Project Geology and Evaluation, a Qualified Person under the terms of National Instrument 43-101 (NI 43-101). Mr. Torr has verified the technical data disclosed in this news release. Base metals and other major-elements assays were determined by multi-acid digestion with ICP finish and PGEs were determined by conventional fire assay and ICP finish at Ultra Trace Geoanalytical Laboratories in Perth, Australia, an ISO 17025-accredited laboratory. Ivanhoe Mines utilized a well-documented system of inserting blanks and standards into the assay stream and has a strict chain of custody and independent laboratory re-check system for quality control.
Information on sample preparation, analyses and security is contained in the Platreef Project NI 43-101 Technical Report dated January 8, 2015, filed on SEDAR at www.sedar.com and on the Ivanhoe Mines website at www.ivanhoemines.com, and will be included in the new Platreef Project NI 43-101 Technical Report to be filed on SEDAR within the next 45 days.
Data verification
Dr. Parker and Mr. Kuhl, (collectively the Amec Foster Wheeler QPs) reviewed the sample chain of custody, quality assurance and quality control (QA/QC) procedures, and the accreditations of analytical laboratories used by Ivanhoe. The Amec Foster Wheeler QPs are of the opinion that the procedures and QA/QC are acceptable to support Mineral Resource estimation. Amec Foster Wheeler also audited the assay database, core logging and geological interpretations on a number of occasions between 2009 and 2015, and found no material issues with the data as a result of these audits.
In the opinion of the Amec Foster Wheeler QPs, the data verification programs undertaken on the geological and assay data collected from the Platreef Project support the geological interpretations, and the analytical and database quality and the data collected can support Mineral Resource estimation.
About Ivanhoe Mines
Ivanhoe Mines is advancing and developing its three principal projects:
- The Kamoa Copper Discovery in a previously unknown extension of the Central African Copperbelt in the Democratic Republic of the Congo (DRC).
- The Platreef Discovery of platinum, palladium, nickel, copper, gold and rhodium on the Northern Limb of the Bushveld Complex in South Africa.
- The historic, high-grade Kipushi zinc-copper mine, also on the Copperbelt in the DRC.
Information contacts
Investors
Bill Trenaman +1.604.331.9834
Media
North America: Bob Williamson +1.604.512.4856
South Africa: Jeremy Michaels +27.11.088.4300
Website www.ivanhoemines.com
FORWARD-LOOKING STATEMENTS
Statements in this news release that are forward-looking statements or information are subject to various risks and uncertainties concerning the specific factors disclosed here and elsewhere in the company’s periodic filings with Canadian securities regulators. When used in this news release, the words such as “could,” “plan,” “estimate,” “expect,” “intend,” “may,” “potential,” “should” and similar expressions, are forward-looking statements. Information provided in this document is necessarily summarized and may not contain all available material information.
The forward-looking information and statements in this news release include commodity price assumptions, statements regarding the potential for the identification of additional Mineral Resources, statements about the potential for significant additional mineralization, statements regarding the potential quantity and grades of mineralization in the four exploration targets, statements regarding the sinking of Shaft 1, including at a daily rate of approximately 2.5 m per day, and statements regarding the planned number of shafts at Platreef and the planned underground mining methods. Readers are cautioned that actual results may vary from those presented.
All such forward-looking information and statements are based on certain assumptions and analyses made by Ivanhoe Mines’ management in light of their experience and perception of historical trends, current conditions and expected future developments, as well as other factors management believe are appropriate in the circumstances. These statements, however, are subject to a variety of risks and uncertainties and other factors that could cause actual events or results to differ materially from those projected in the forward-looking information or statements including, but not limited to, unexpected changes in laws, rules or regulations, or their enforcement by applicable authorities; the failure of parties to contracts to perform as agreed; social or labour unrest; changes in commodity prices; unexpected failure or inadequacy of infrastructure, or delays in the development of infrastructure, and the failure of exploration programs or other studies to deliver anticipated results or results that would justify and support continued studies, development or operations. Other important factors that could cause actual results to differ from these forward-looking statements also include those described under the heading “Risk Factors” in the company’s most recently filed MD&A as well as in the most recent Annual Information Form filed by Ivanhoe Mines. Readers are cautioned not to place undue reliance on forward-looking information or statements. The factors and assumptions used to develop the forward-looking information and statements, and the risks that could cause the actual results to differ materially are presented in the body of the Technical Report that will be filed on SEDAR at www.sedar.com and Ivanhoe Mines’ website at www.ivanhoemines.com within 45 days of this news release.
This news release also contains references to estimates of Mineral Resources. The estimation of Mineral Resources is inherently uncertain and involves subjective judgments about many relevant factors. Mineral Resources that are not Mineral Reserves do not have demonstrated economic viability. The accuracy of any such estimates is a function of the quantity and quality of available data, and of the assumptions made and judgments used in engineering and geological interpretation, which may prove to be unreliable and depend, to a certain extent, upon the analysis of drilling results and statistical inferences that may ultimately prove to be inaccurate. Mineral Resource estimates may have to be re-estimated based on, among other things: (i) fluctuations in platinum, palladium, gold, rhodium, copper, nickel or other mineral prices; (ii) results of drilling; (iii) results of metallurgical testing and other studies; (iv) changes to proposed mining operations, including dilution; (v) the evaluation of mine plans subsequent to the date of any estimates; and (vi) the possible failure to receive required permits, approvals and licences.
Although the forward-looking statements contained in this news release are based upon what management of the company believes are reasonable assumptions, the company cannot assure investors that actual results will be consistent with these forward-looking statements. These forward-looking statements are made as of the date of this news release and are expressly qualified in their entirety by this cautionary statement. Subject to applicable securities laws, the company does not assume any obligation to update or revise the forward-looking statements contained herein to reflect events or circumstances occurring after the date of this news release.


 English
 Français
 日本語
日本語 中文
中文